With customers across every foodservice category in every US state, we began tracking restaurant sales trends across the US at the onset of the pandemic in 2020. This post provides a look back at that data and how the industry began rising toward recovery.
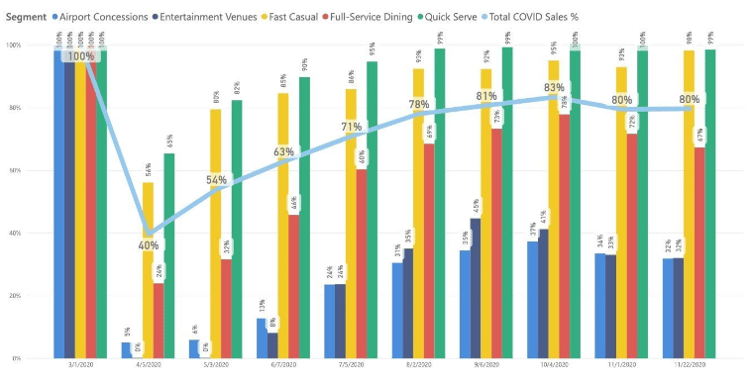
US Restaurant Sales by Week (3/1/20 – 11/22/20)
- To determine the pre-COVID-19 benchmark, we calculated restaurant sales as a percentage of spend that occurred the week of March 1, 2020.
- The colored bar charts represent the different restaurant industry segments and the blue line tracks total sales compared to the pre-COVID-19 period.
- Across all segments, restaurant chain and foodservice industry sales for the week of November 16-22, 2020 were at 80% of pre-COVID-19 levels.
QSR: 99% (-1%)
Fast Casual: 98% (+5%)
Full-Service Dining: 67% (-5%)
Entertainment Venues: 32% (-1%)
Airport/Travel Concessions: 32% (-2%)
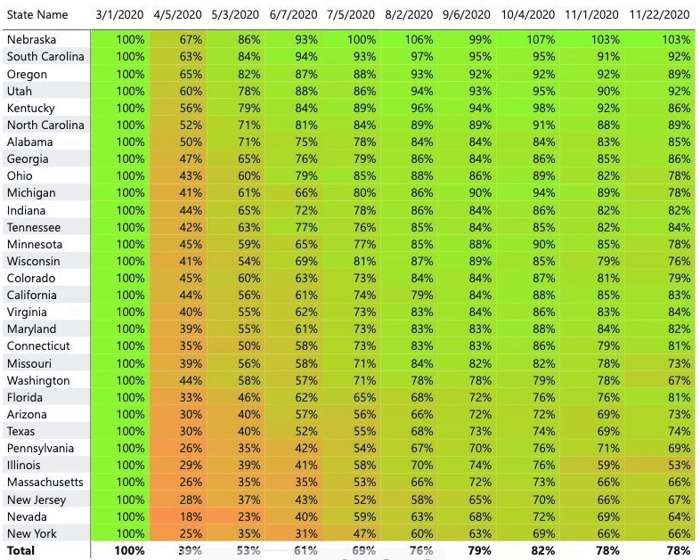
Top 30 States: Week-Over-Week Performance (3/1/20 – 11/22/20)
About the Data:
This data from 2020 shows weekly foodservice sales at chain restaurants in the United States on the Crunchtime operations management platform across the following segments: Airport Concessions, Entertainment Venues, Fast Casual, Full-Service Dining, and Quick Service.
Sales data includes: credit cards, cash, online orders, take-out, and delivery (all store sales collected from a POS).
Independent (non-chain) restaurants are not included in this sample. Only states with a statistically significant number of locations across each segment were used for this data analysis.
Questions about Crunchtime? Please contact us.