A Menu Engineering Analysis can optimize your menu items and ensure you're only selling the products that your guests love and are profitable.
Simply put, menu engineering is the science of designing a menu in a way that maximizes a restaurant's profits.
Many restaurants that invest in menu engineering see profits jump by 10-15% or more. Restaurants of all sizes can leverage menu science to build a profitable menu, but menu engineering is much more than creating a menu that is enticing to the customer's eye. It starts with understanding the specific ingredients that go into making each dish and their food cost percentages. A menu engineering matrix can provide operators with a visual representation of the menu's profitability and is a useful framework to evaluate and optimize the menu for greater profits.
What is Menu Costing?
This first step in the menu engineering process is menu costing or "food costing your menu." Costing a menu determines, right down to the penny, how much it costs to create each dish your restaurant offers, excluding labor costs. This cost is subsequently subtracted from the menu items sales to arrive at your contribution margin or gross profit.
The contribution margin, or gross profit,is how much profit you make on a single menu item after the cost of ingredients have been subtracted.
Contribution Margin = Selling Price – Cost of Ingredients
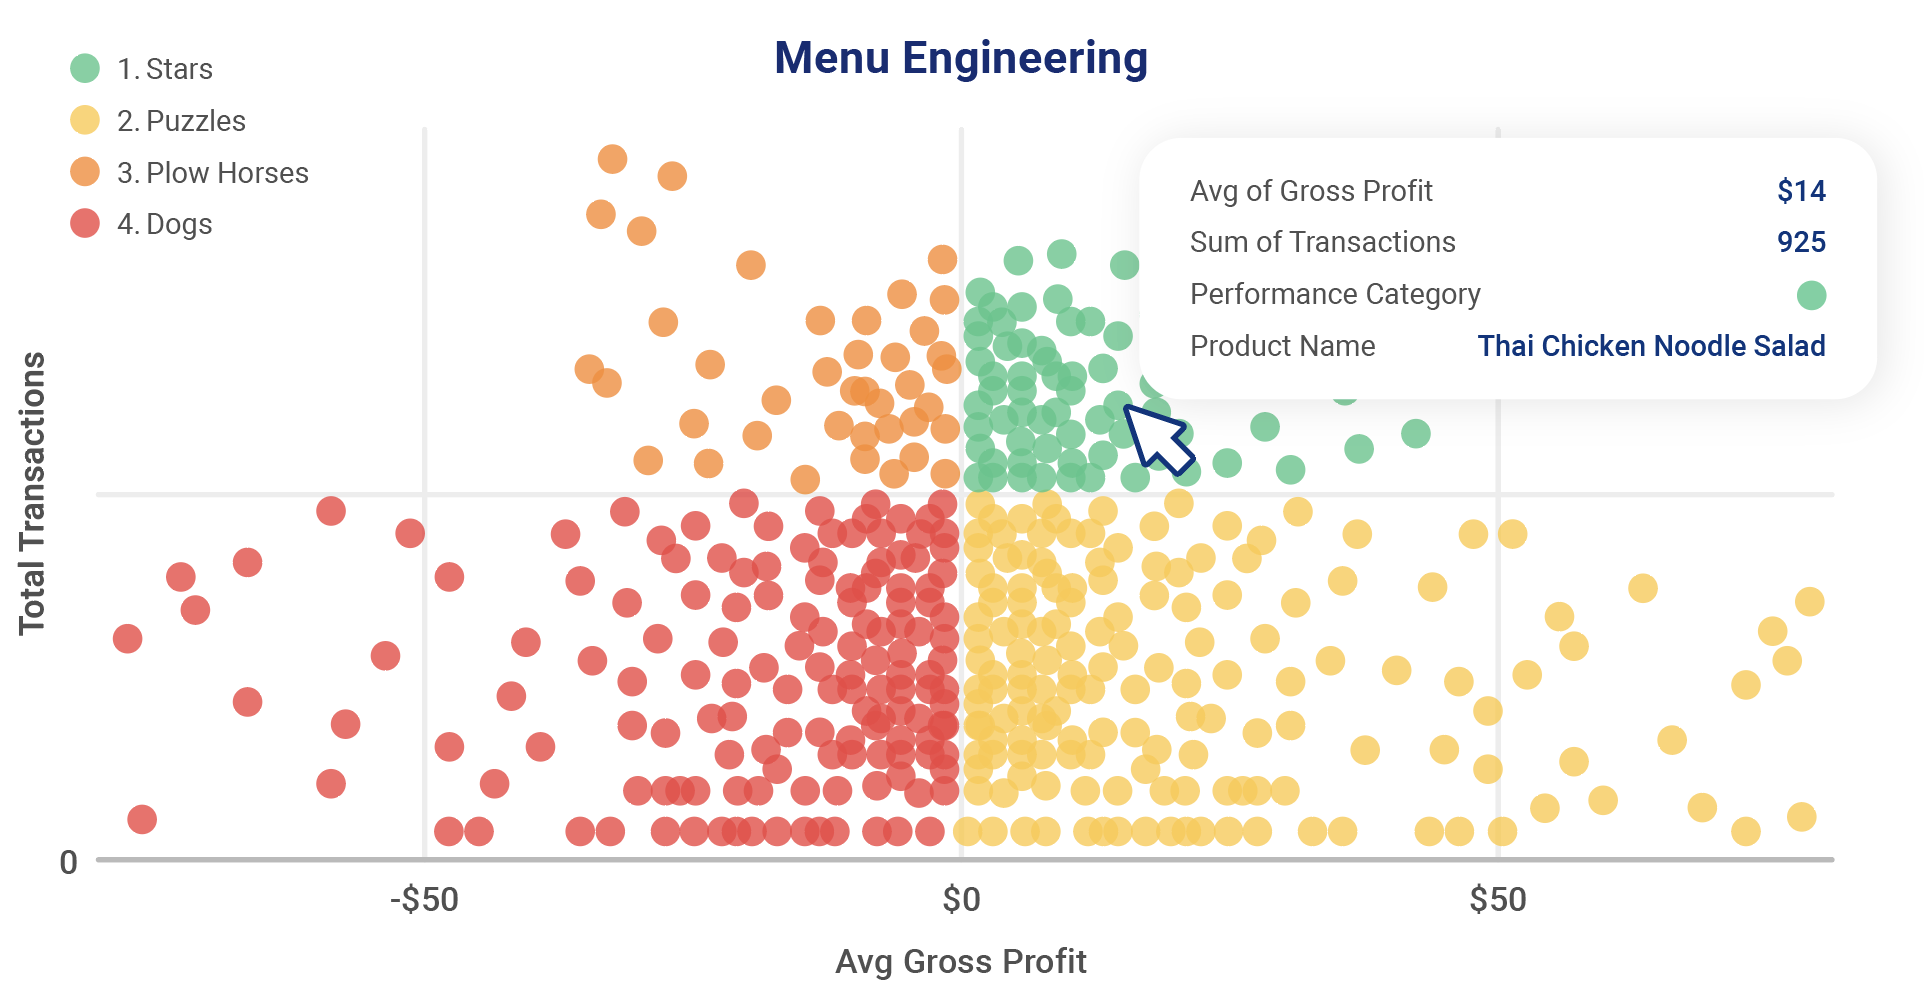
Once food costs have been determined, the next step is to determine item popularity by gathering a count of each item sold in a given time period. With margin and transaction volume in hand, menu items can then be plotted in a menu engineering matrix, categorizing items into one of four categories:
STARS: High Profitability, High Popularity Your stars are menu items that are the most popular with your guests and the most profitable for you. These are your super star menu items that should be promoted whenever possible.
PLOW HORSES: Low Profitability, High Popularity The solid-performing plow horses are products that guests love but have higher food costs. When possible, evaluate plow horse costs, menu price or portion size for these menu items.
PUZZLES: High Profitability, Low Popularity These products would bring you high profitability, if only your customers would order them more often. They're a puzzle to figure out. These dishes challenge you to increase their popularity without increasing the cost to make them.
DOGS: Low Profitability, Low Popularity Dogsare neither profitable or popular among guests. These dog menu items should be evaluated to determine if they can be cut from the menu.
How Can Menu Engineering Help Your Restaurant?
A quick Menu Engineering Analysis report from your restaurant management software can take the guesswork out of categorizing menu items and in turn, eliminate the need for many in-house labor hours spent on a manual menu data analysis.
By using quality BOH restaurant tech and a data warehouse, the process of menu engineering is simple and straight forward. After selecting location(s) and a time frame, decision makers can quickly evaluate how menu items are performing while visualizing and interacting within their data through multiple options.
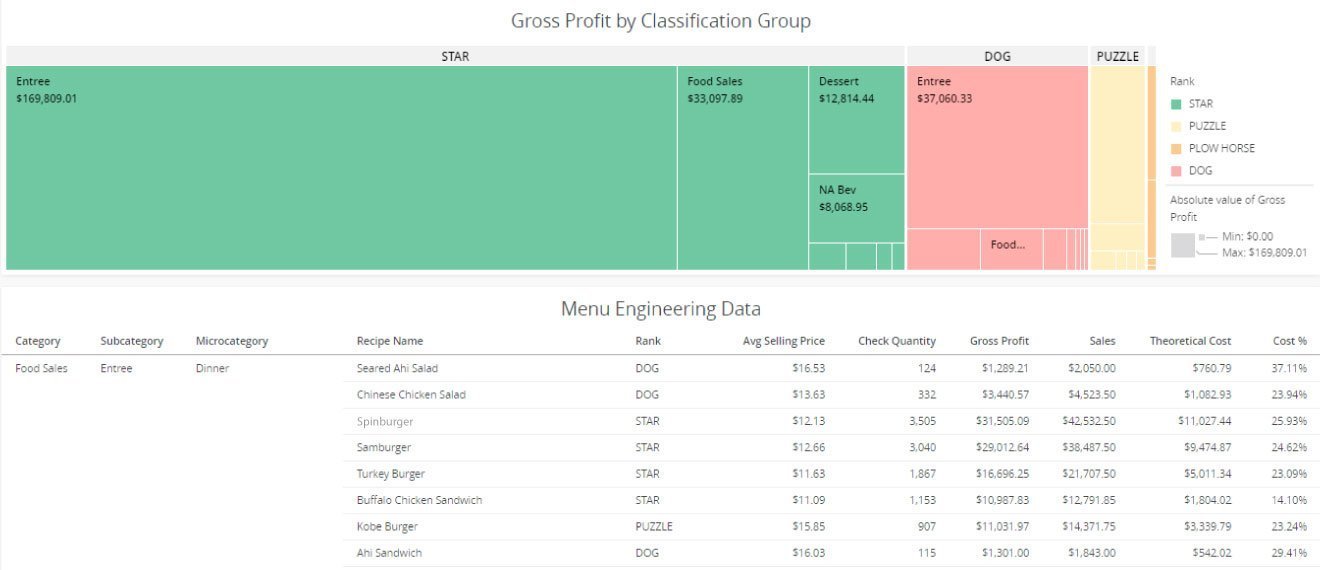
In the example below, Stars, Plow Horses, Puzzles and Dogs are represented as a heat map, which allows users to quickly drill into all items within a classification group.
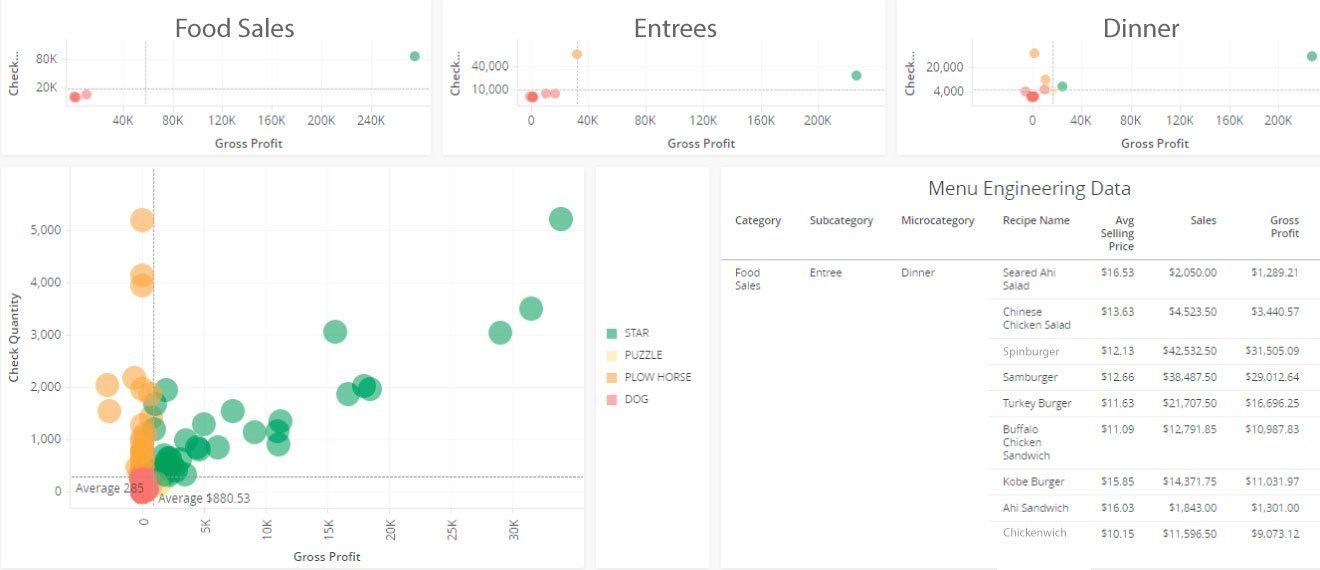
Alternatively, users can view their menu items plotted in relation to one another with the ability to filter by category (eg: Food Sales) , subcategory (eg: Entree) and microcategory (eg: Dinner) visually or using selectors. In these views, users are able to exclude outliers or drill into a specific cluster of menu items in order to gain a better understanding of their data.
Baselines used to categorize menu items are derived from the average gross profit and check quantity for all items selected. These averages dynamically adjust based on selection to provide restaurant operators with a clear picture of how the selected items stack up.
Equipped with the data provided in the Menu Engineering Analysis report in Crunchtime's restaurant management software, operators can identify their highest and lowest performers along with the menu items that have room for improvement. A menu engineering matrix makes it easy for operators to interpret this data and take action, with the next steps of selecting the best items and laying out the menu in an optimal way that maximizes profits.
Now is the perfect time for restaurant professionals to get strategic about their approach to menu science and keep profits as high as possible.
If you have more questions about menu engineering, food costing, or you would like to learn about how customers are using Crunchtime's restaurant software to optimize their menus for greater profitability, get in touch with us.