Updated January 2026
Every restaurant manager can use these reports to help them optimize inventory and control labor costs
In restaurant operations, managing profitability can be a moving target. Operators need access to a variety of data to understand how their stores are performing and identify where profit leaks might be occurring. Accurate, timely reporting can reveal opportunities for cost savings, but it can be difficult to know where to begin.
To help get you started, we’ve highlighted 8 of the top restaurant reports that are available in Crunchtime Inventory Management and Labor & Scheduling. Leveraging restaurant management software with these reports can help you improve daily restaurant tasks, optimize inventory, and control labor costs.
Report #1: Actual vs. Theoretical (AvT) Cost Items
What is it?
Actual versus theoretical reports are the gold standard for food cost control in the restaurant industry. The report shows a breakdown of the items in your kitchen that have the highest variances between their actual cost and their theoretical costs.
Actual food costs refer to the real, tangible expenses incurred by the restaurant for the items to prepare menu items during a specific period. Theoretical food costs represent what the food cost should be, if all factors are aligned perfectly: the current inventory count, ingredient pricing, how much was sold, standardized recipes, assuming perfect portions, and assuming no breakage or shrinkage. The goal is to reduce the variance between these two numbers to the lowest possible point. You can learn more about AvT here.
Why is it important?
Monitoring actual versus theoretical food costs is fundamental to controlling food costs and running a profitable restaurant. If the report shows an ingredient is consistently exceeding theoretical costs, corrective actions may be needed. It could be time to adjust your menu pricing, or further investigation could reveal that the high variance is a result of over-portioning or incorrect preparation. This could signal that recipe standardization or staff training is necessary.
While most restaurant operators track their food cost as a percentage, an AvT report goes one step further by accounting for other factors like inventory breakage and shrinkage. This can provide a much more precise understanding of how profitable your restaurant truly is.
Keep this report front and center on your dashboard to help you prioritize food cost control and identify variances that otherwise might go unnoticed. It is also worth noting that without restaurant inventory software, generating this report would be incredibly difficult and time-consuming, even for the most seasoned restaurant professional.
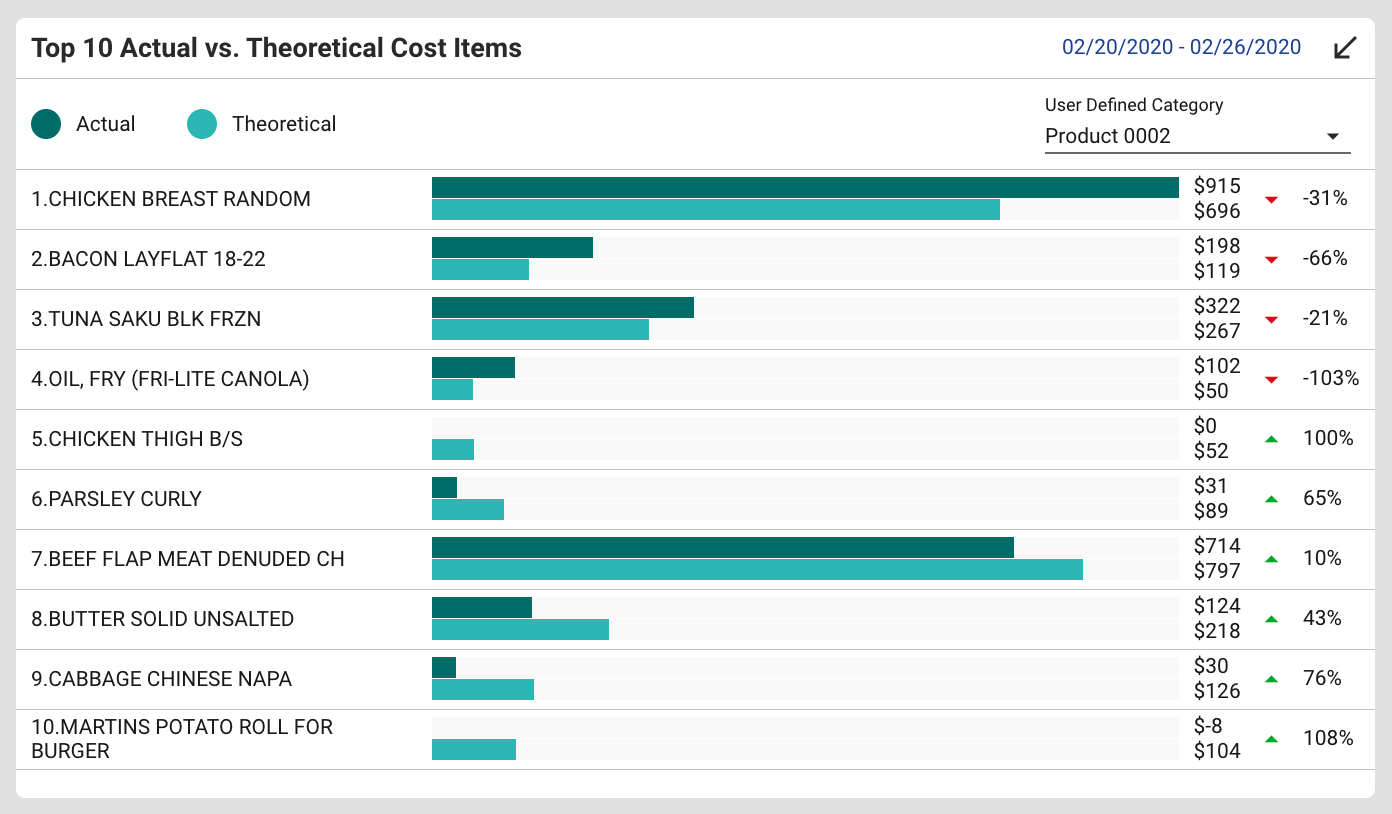
Pictured above: An example report of Actual vs. Theoretical variance in Crunchtime.
Report #2: Top 10 Menu Mix Sales Items
What is it?
This report assesses the profitability of individual items on the menu by comparing sales, costs, and the gross profit for each item. The top 10 selling items are highlighted in an easy-to-read bar chart so managers can quickly understand the data.
Why is it important?
This report provides insight into your most profitable menu items. Given the high cost of food, menu engineering has become essential to restaurant success. By identifying which items are the most and the least profitable, restaurants can make informed decisions about what to keep, modify, or remove from the menu. It also helps in creating new, profitable menu items. You can learn more about menu engineering here.
If the report shows that a particular menu item is consistently a top seller, you should be fully aware of the cost you incur to create and serve that particular item. For instance, you wouldn't want your top-selling menu item to be losing you money. The Menu Mix Sales Report gives you insights to draw these conclusions.
If you find that several of your popular dishes are highly cost-effective, you may decide to promote them more prominently on the menu. Conversely, you might find that one of your top-selling items is actually not cost-effective because of the high expenses you incur to produce it. This may lead you to adjust pricing or remove the item altogether from the menu.
By regularly analyzing the profitability of your most popular menu items, operators can make informed decisions that lead to cost control, improved pricing strategies, and overall financial stability.
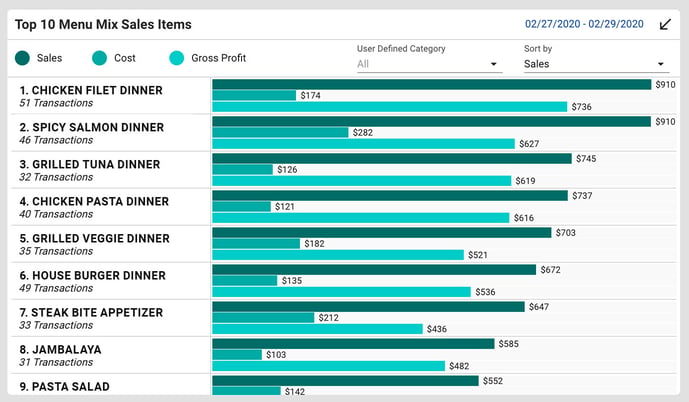 Pictured above: The Top 10 Menu Mix Sales Items Report in Crunchtime
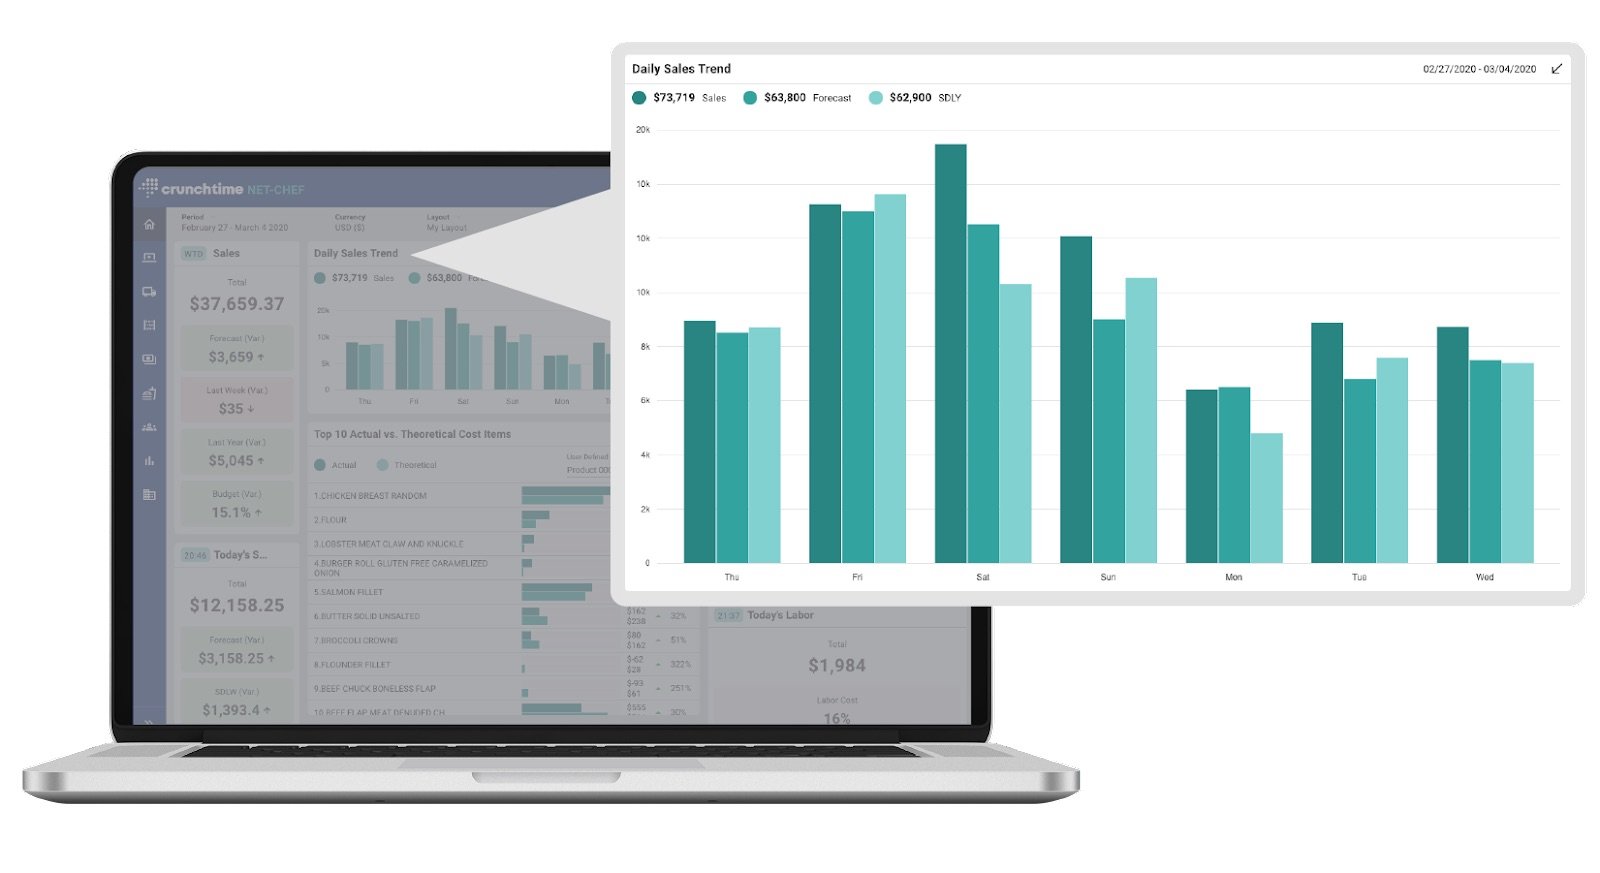
Report #3: Daily Sales Trend
What is it?
This report shows a breakdown of your sales for each day of the week, compared to the same day last year and the forecasted sales.
Why is it important?
Comparing weekly sales against historical sales and forecasted sales can help restaurant operators assess their performance and make informed decisions that boost profits and enhance the customer experience. If sales are consistently falling short, it may indicate there are operational issues that need to be addressed.
Keeping this data easily visible can help operators identify operational inefficiencies that may be impacting sales. This insight can lead to process improvements and more streamlined operations. Significant discrepancies between forecasted and actual sales could indicate potential problems or irregularities in the business. Early detection can also help to mitigate risks and operators can take corrective actions to prevent any financial issues from escalating.
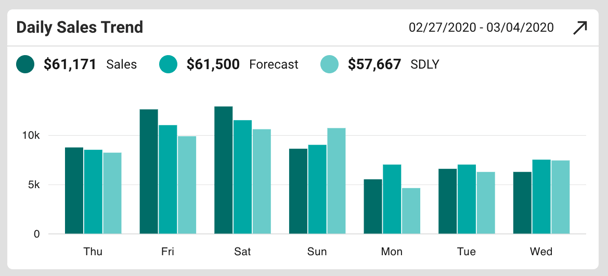 Pictured above: An example report of Daily Sales Trends in Crunchtime
Report #4: Inventory Waste
What is it?
An inventory waste report tracks food and beverage waste in your restaurant's inventory. It provides an overview of losses that can occur due to a variety of factors, including spoilage, production errors, breakage, vendor returns, overcooked, expirations, and more.
Why is it important?
The waste report is a vital tool for controlling costs and maximizing profitability for restaurants. It can help restaurant professionals identify areas where food and beverage resources are being mismanaged, enabling them to take corrective actions to minimize waste, improve operational efficiency, and maintain a more sustainable business.
In the sample report below, expired food is a primary driver of waste. Management can take corrective actions by reviewing their purchasing process and leveraging Crunchtime’s suggested order engine. Using your sales forecast and inventory levels, Crunchtime advises the optimal quantities needed to meet demand. By limiting waste from expired goods, your restaurants can expect to reduce unnecessary amounts of inventory on hand and boost cash flow for greater profitability.
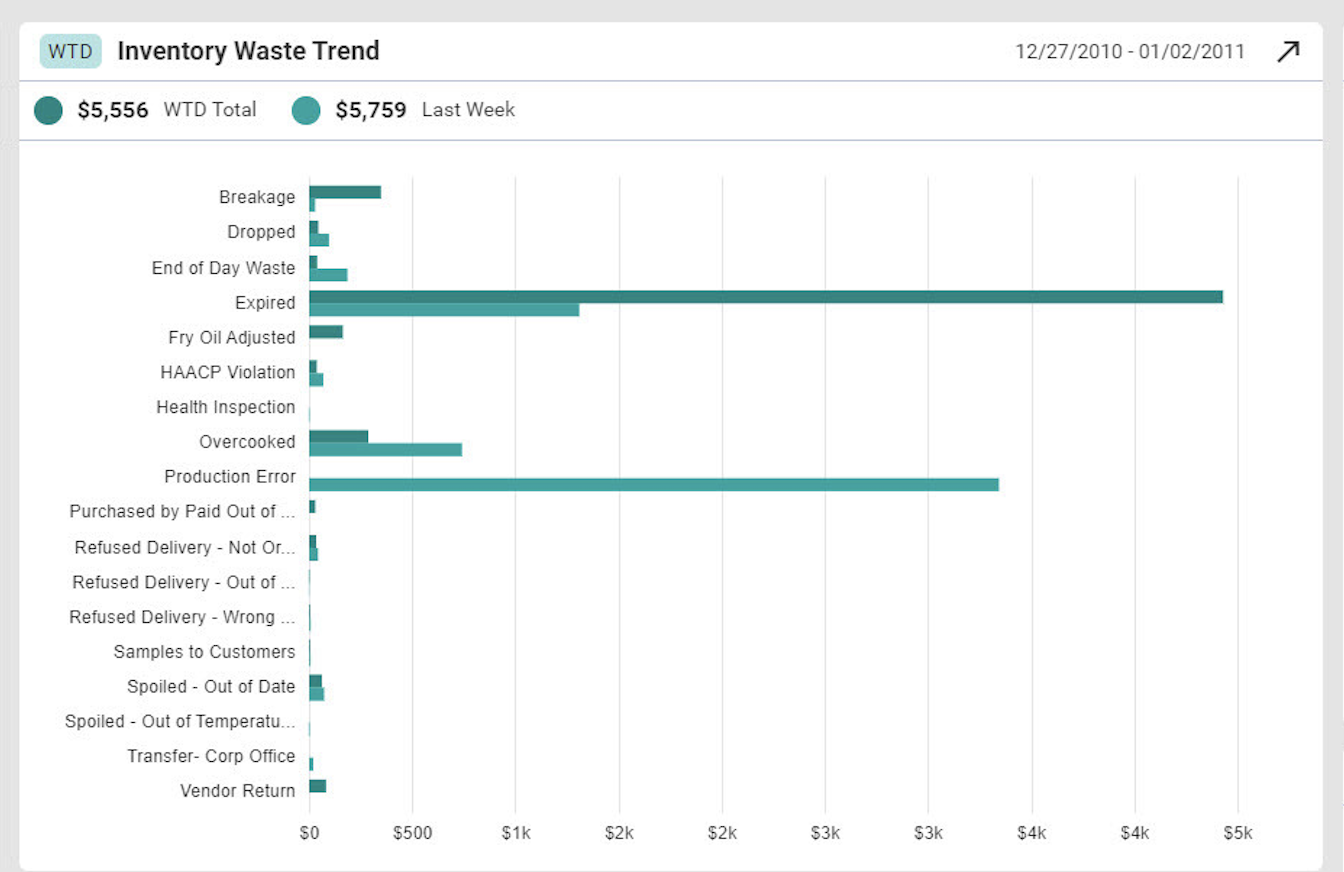 Pictured above: An example report of waste tracked weekly in Crunchtime
Report #5: Daily Labor Summary with Ideal Hours
What is it?
This report provides a historical overview of your daily labor over the past week. It shows the actual labor hours that were worked by your team each day of the week, compared to the number of hours that were scheduled. It also shows the ideal hours for each day, which is the number of hours that Crunchtime suggests you schedule, based on sales forecasts and your restaurant’s predetermined staffing level templates.
Why is it important?
This report is key to understanding how well you are creating staff schedules in response to demand. Restaurant operators can use this report to identify labor trends and make more informed decisions regarding staffing levels and labor costs.
In the example report below, the ideal hours are consistently less than the actual and scheduled hours. If your restaurant is regularly scheduling over the ideal hours, it may signal that you are overspending on labor, and you need to drill deeper into additional labor reports about shift details, labor productivity, time clock audits, or other data sources in the Crunchtime platform.
Keep this report handy on your dashboard to get timely insights into your restaurant's labor dynamics and understand labor trends.
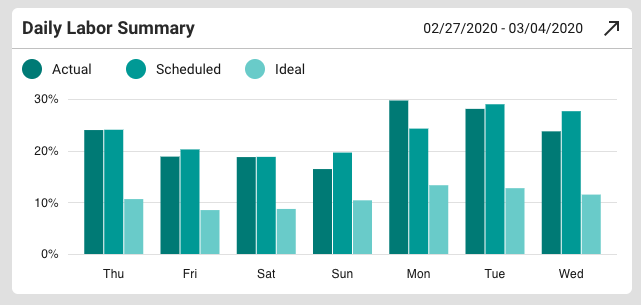 Pictured above: An example report of the Daily Labor Summary in Crunchtime
Report #6: Daypart Sales Report
What is it?
This report breaks down your sales by different meal periods. The example report below shows sales across the categories of lunch, dinner, and late night.
Why is it important?
Separating sales by meal periods allows restaurants to understand the revenue generated during different times of the day. This information is crucial for assessing the financial performance of the business and identifying which meal periods are the most profitable.
Different meal periods may also require different pricing strategies. By analyzing sales data for each period, restaurants can determine whether they need to adjust menu pricing, offer special promotions, or create meal-specific deals to attract more customers.
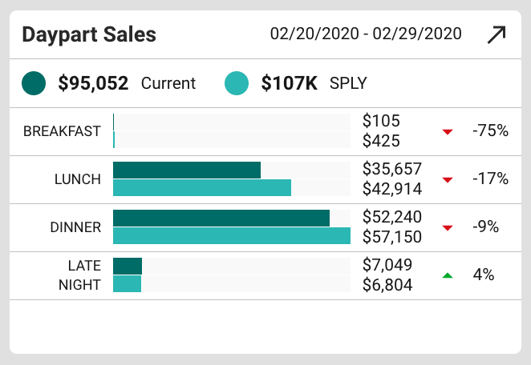
Pictured above: An example report of the Daily Sales Report in Crunchtime
Report #7: Today's Tasks
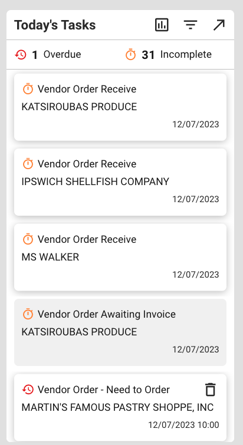
What is it?
The Tasks Report provides managers with a clear structured plan for the day that ensures all essential tasks are accounted for and prioritized. This report shows the most important tasks for each store location like counting inventory, placing orders, post-labor periods, reviewing labor actuals, and much more. For users with admin access or regional managers, the daily tasks show an above-store-level view of the most critical outstanding tasks across multiple store locations.
Why is it important?
Restaurant operators have a multitude of responsibilities, and the task report helps them allocate their time efficiently and prevent tasks from falling through the cracks. By prioritizing the most urgent tasks that need to be addressed promptly, managers can stay organized with less effort. Above-store management can also review task lists to get a better understanding of daily operations or outstanding tasks at each store.
Keeping your task list front and center on the dashboard is highly recommended to ensure that daily operations run smoothly and efficiently at every store location.
Report #8: Daily/Weekly finance reports to keep you on track
Because these reports are so important, we couldn't pick just one! Operators should always have their most critical financial metrics on hand, in an easy-to-interpret format. Helpful financial reports include the following:
- Week-to-Date (WTD) Sales
- Week-to-Date (WTD) Labor Costs
- Week-to-Date (WTD) Comps & Discounts
- Week-to-Date (WTD)Guest Count
- Today’s Sales
- Today’s Labor
- Today’s Guests
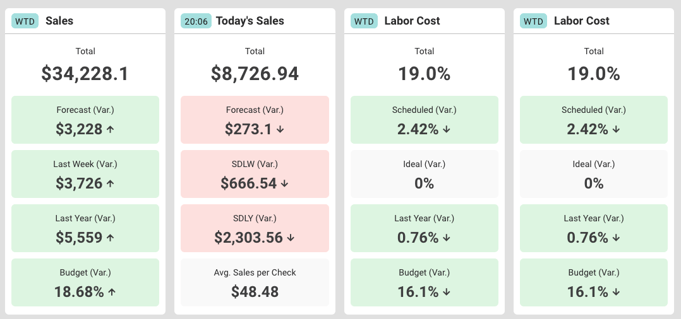
Pictured above: Crunchtime's tile reports display critical financial metrics for operators
In Crunchtime, the data displayed on the green tiles indicates positive trends in the data, while red indicates you may be falling behind the target goal. The differentiation by color makes it easy to know how your restaurant is doing with just a glance.
Easily compare your week-to-date sales against your forecast, the prior week, or the prior year to understand how your business is performing and where you can improve. You can also get a clear view of your labor costs and the variance between your scheduled labor and actual.
Displaying these reports on your dashboard will ensure that critical metrics stay at the top of mind for your restaurant operators. Tile reports include: WTD Sales, WTD Labor Costs, WTD Comps & Discounts, WTD Guest Count, Today’s Sales, Today’s Labor, and Today’s Guests.
Always Customize the Dashboard for Your Reporting Needs
You can easily customize your Crunchtime dashboard to show the restaurant operations reports that are most important to your business. Simply drag and drop the report widgets in place. If you change your mind, no problem–you can easily rearrange the layout in just a few clicks.
Crunchtime also allows for corporate users to assign a dashboard layout for all store locations to use. This consistency across stores can help management set goals for success. Utilizing the right reports and data is instrumental in aligning your teams on top priorities and boosting productivity across each store location.
Final Thoughts
Restaurant reports are vital tools to monitor, analyze, and improve various aspects of operations. The reports in your Crunchtime dashboard are designed to provide your restaurants with actionable insights that contribute to better decision-making, increased efficiency, and long-term sustainability in a competitive industry.
Ready to learn more about Crunchtime?
Find out how Crunchtime's restaurant management software can optimize your operations.
Reach out to us today for a customized demo.